Quick Refresh : UML
Unified Modeling Language (UML) is a graphical way of describing software systems. In this tutorial series, I cover Use Case, Activity, Class, Object, Sequence and many more UML Diagrams. Understanding the thirteen diagrams of UML 2.x is an important part of understanding OO development.
There are three classifications of UML diagrams:
- Class diagram: describes the structure of a system by showing the system's classes, their attributes, and the relationships among the classes.
- Component diagram: describes how a software system is split up into components and shows the dependencies among these components.
- Composite structure diagram: describes the internal structure of a class and the collaborations that this structure makes possible.
- Deployment diagram: describes the hardware used in system implementations and the execution environments and artifacts deployed on the hardware.
- Object diagram: shows a complete or partial view of the structure of an example modeled system at a specific time.
- Package diagram: describes how a system is split up into logical groupings by showing the dependencies among these groupings.
- Profile diagram: operates at the metamodel level to show stereotypes as classes with the <<stereotype>> stereotype, and profiles as packages with the <<profile>> stereotype. The extension relation (solid line with closed, filled arrowhead) indicates what metamodel element a given stereotype is extending.
(2) Behavior diagrams - Behavior diagrams emphasize what must happen in the system being modeled. Since behavior diagrams illustrate the behavior of a system, they are used extensively to describe the functionality of software systems.
- Activity diagram: describes the business and operational step-by-step workflows of components in a system. An activity diagram shows the overall flow of control.
- UML state machine diagram: describes the states and state transitions of the system.
- Use Case Diagram: describes the functionality provided by a system in terms of actors, their goals represented as use cases, and any dependencies among those use cases.
Interaction diagrams - Interaction diagrams, a subset of behavior diagrams, emphasize the flow of control and data among the things in the system being modeled:
- Communication diagram: shows the interactions between objects or parts in terms of sequenced messages. They represent a combination of information taken from Class, Sequence, and Use Case Diagrams describing both the static structure and dynamic behavior of a system.
- Interaction overview diagram: provides an overview in which the nodes represent communication diagrams.
- Sequence diagram: shows how objects communicate with each other in terms of a sequence of messages. Also indicates the lifespans of objects relative to those messages.
- Timing diagrams: a specific type of interaction diagram where the focus is on timing constraints.
=================
1 Use Case : Use Case Diagrams focus on the steps a system needs to follow to reach a goal.
2 Activity Diagrams : Activity diagrams show what actions occur step-by-step to achieve a given goal.

3 Class Diagrams : Class diagrams describe classes and how they relate to each other. also shows abstraction, encapsulation, visibility, multiplicity, dependence, inheritance, constraints.
4 Object Diagrams
An object diagram may be considered a special case of a class diagram. Object diagrams use a subset of the elements of a class diagram in order to emphasize the relationship between instances of classes at some point in time. They are useful in understanding class diagrams. They don’t show anything architecturally different to class diagrams, but reflect multiplicity and roles.

5 Sequence diagrams
Sequence diagrams model interactions in your program and provide you with a logical way to layout your system. They are about showing the order of interactions between the parts of your program.
In making sequence diagrams, you describe which interactions are triggered and when. They focus in on the order of events in all interactions.

6 Communication diagrams
Communication diagrams are used to show links between participants. They focus in on which interactions are triggered and when. They also describe the order of events in all interactions.
7 Interaction Overview Diagrams
An interaction overview diagram is a form of activity diagram in which the nodes represent interaction diagrams. Interaction diagrams can include sequence, communication, interaction overview and timing diagrams. Most of the notation for interaction overview diagrams is the same for activity diagrams. For example, initial, final, decision, merge, fork and join nodes are all the same. However, interaction overview diagrams introduce two new elements: interaction occurrences and interaction elements.
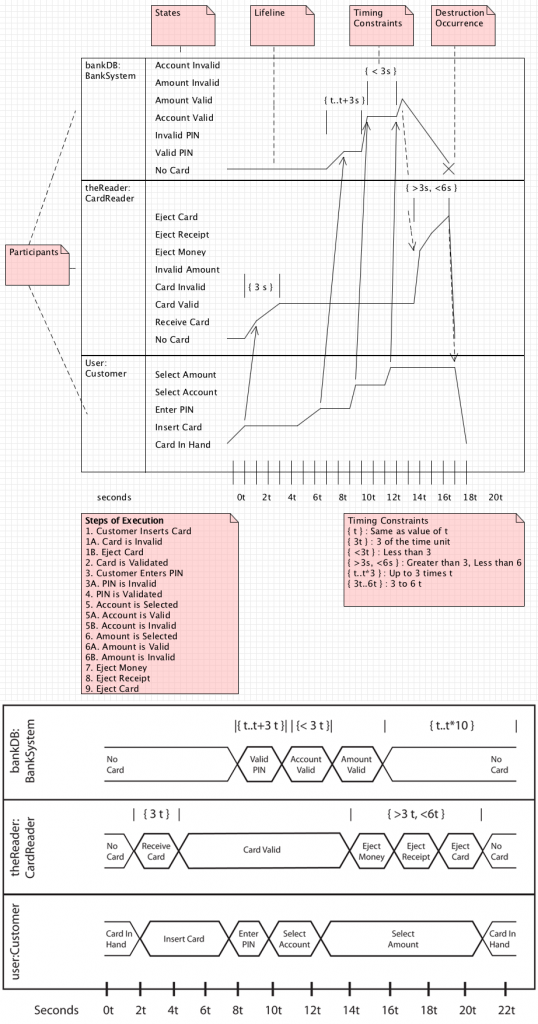
8 Timing Diagrams
UML timing diagrams are used to detail interactions based on time. With timing diagrams you’ll describe when an event occurs, how long it takes for other participants to react and how long they’ll take to complete an interaction.
9 Component Diagrams
Blocks of code are set up as components to create reusable blocks of code. Component diagrams are then used to show how components are used to create software systems.
10 Composite Diagrams
A composite structure diagram is a diagram that shows the internal structure of a classifier, including its interaction points to other parts of the system. It shows the configuration and relationship of parts, that together, perform the behavior of the containing classifier. classes can be displayed as composite elements exposing interfaces and containing ports and parts.
11 State Machine Diagrams
State machine diagrams model the changing states of objects and the events that cause these state changes.

12 Package diagram
Package diagram shows the arrangement and organization of model elements in middle to large scale project. Package diagram can show both structure and dependencies between sub-systems or modules. Example in above image
13 Deployment diagrams
You use deployment diagrams to show how software and hardware work together. It shows nodes, artifacts, dependency arrows, communication lines, deployment specs.


Comments
Post a Comment