Java Memory Leak Analysis
This Article is not complete... It is in Progress -
Common Causes of Memory Leak :
Memory Leak in your application can happen because following reasons -
 (1) Bad Programming -
(2) Server Configuration
(4) Wrong use of Cache.
Approaches for Memory Leak Analysis :
There are couple of things that we can do-
Common Causes of Memory Leak :
Memory Leak in your application can happen because following reasons -
 (1) Bad Programming -
 - Unnecessary creation of objects and holding their references for longer time, specially static objects. static objects gets memory in perm gen.
- Wrong configuration of EJB components.
(2) Server Configuration
- Heap Setting
- Thread Count
- Garbage Collection Algorithm
(4) Wrong use of Cache.
Approaches for Memory Leak Analysis :
There are couple of things that we can do-
- Memory Profiling of application - JProbe
- Thread Dump Analysis - Eclipse Plugin
- Heap Dump Analysis - JMap Utility for capturing Heap Dump, IBM Heap Analyzer
- Heap Object Dump analysis - Manual Code for analysis.
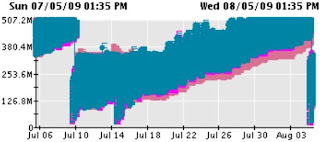
- Monitoring of the System - Introscope (watch Memory and Thread usage graph), LeakHunter
Prevent Memory Leak :
- Choose GC algorithm carefully. Parallel GC with Mark and Sweep Collector (MSC) works fine in most of the cases.
Please leave your comments and suggestions below...


Comments
Post a Comment